
Stock quotes pack essential data into a few key numbers. The stock symbol acts as the company’s ID, while current price and changes show immediate performance. Bid and ask prices reveal what buyers and sellers want, with the spread between them indicating popularity. Trading volume suggests investor interest level. Additional metrics like P/E ratio and market cap provide deeper context. Understanding these components unveils the story behind any stock.
Stock quotes can look like a jumbled mess of numbers and abbreviations to the untrained eye. But there’s a method to the madness. Every stock has a unique symbol – a shorthand code of one to five letters that acts as its identity card in the market. Think of it as the stock’s nickname, making it easier to look up than typing out “International Business Machines Corporation” every single time.
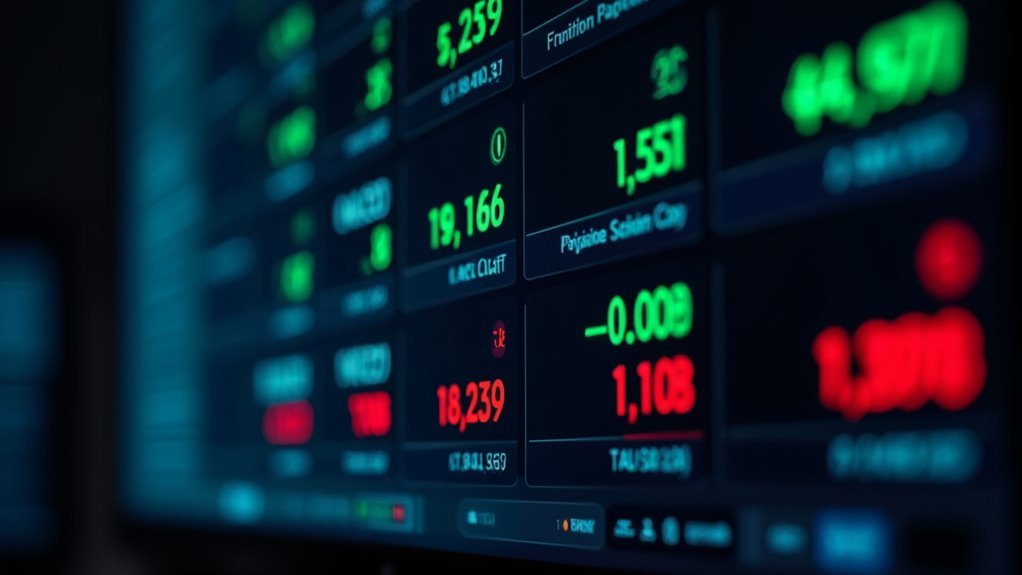
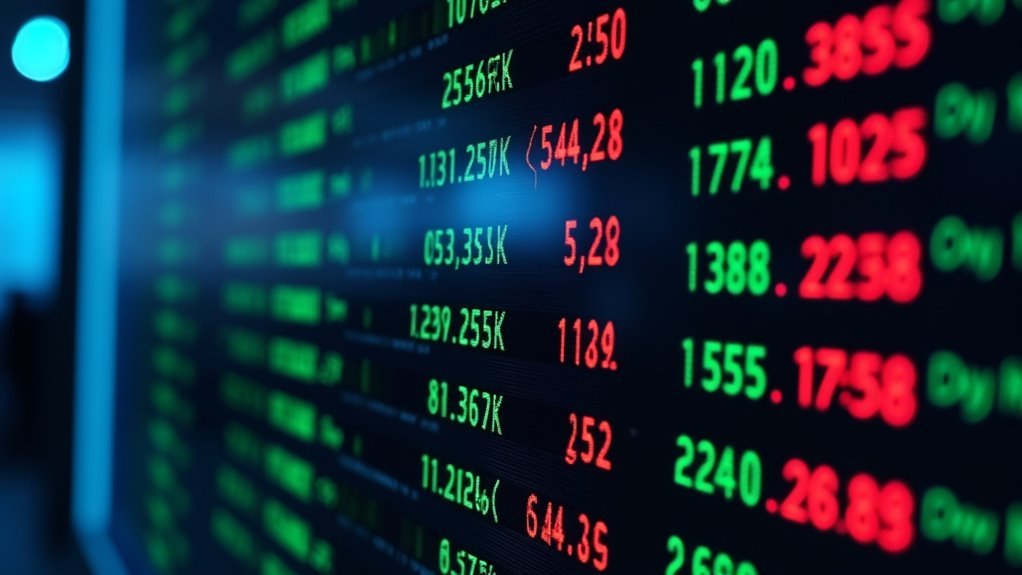
The current price is front and center – it’s literally what everyone’s obsessing over during market hours. It’s constantly changing, like a hyperactive toddler after too much sugar. Right next to it, you’ll find the day’s price change, both in dollars and percentages. Green means you’re winning, red means… well, better luck tomorrow. Stock issuance raises funds for companies looking to expand and grow.
Stock prices dance like caffeinated toddlers, flashing green and red, telling us if we’re winning or crying today.
Then there’s the fascinating dance between bid and ask prices. The bid is what buyers are willing to pay, while the ask is what sellers want. Understanding these prices helps investors make informed trading decisions. The difference between them? That’s called the spread. A tiny spread means the stock is popular – like that one restaurant where you can never get a table. A big spread? Let’s just say it’s not exactly the hottest ticket in town.
Volume tells you how many shares are changing hands. High volume means everyone’s fighting over the stock like it’s the last slice of pizza. Low volume? Crickets. Like compound interest, consistent trading volume over time can indicate growing investor interest.
The 52-week high and low prices give you the bigger picture – they’re like the stock’s greatest hits and biggest flops from the past year.
For the real stock market nerds, there are additional metrics to geek out over. Market cap shows you the company’s total value. P/E ratio tells you if the stock is expensive relative to its earnings. Dividend yield? That’s the percentage of your investment the company pays you just for showing up. Beta measures how dramatic the stock is compared to the market, and EPS shows how much profit each share earns.
Simple, right? Well, maybe not simple, but at least it’s not rocket science.
Frequently Asked Questions
What Time of Day Is Best to Buy or Sell Stocks?
The first and last hours of trading pack the most punch.
Market open (9:30-10:30 AM ET) brings major volatility and volume – perfect for aggressive traders who love chaos.
The notorious “power hour” (3:00-4:00 PM ET) sees another surge as day traders scramble to close positions.
Mid-day is pretty dead, especially during lunch.
After-hours trading? That’s when the pros play their games.
How Much Money Do I Need to Start Investing in Stocks?
Getting started in stocks doesn’t require a fortune these days. Some brokers accept as little as $1-5 to begin investing.
Traditional mutual funds typically want $500-3000 minimum. ETFs? Just need enough for one share.
Robo-advisors are even cheaper, often starting at zero to $100. Modern platforms offer fractional shares, so investors can own pieces of pricey stocks like Amazon or Google.
The barrier to entry has never been lower.
Can I Buy Stocks Without Using a Broker or Trading Platform?
Yes, it’s possible to skip brokers entirely.
Direct Stock Purchase Plans (DSPPs) let investors buy shares straight from companies.
Another option: Dividend Reinvestment Plans (DRIPs) for dividend-paying stocks.
Both work through transfer agents – the middlemen between companies and shareholders.
But there’s a catch: limited stock selection, higher minimum investments, and slower trades.
Not exactly convenient, but hey – it’s broker-free.
What Happens to My Stocks if the Company Goes Bankrupt?
When companies go bankrupt, stockholders usually get crushed. Period.
In Chapter 11 reorganization, shares typically become severely diluted – if they survive at all.
Chapter 7 liquidation? Even worse. Stockholders stand dead last in line for any leftovers, behind creditors and bondholders.
Sometimes shares keep trading, but they’re basically zombies walking to zero. A rare few companies emerge from bankruptcy intact, but don’t count on it.
How Do Stock Splits Affect the Value of My Investment?
Stock splits don’t change the total value of an investment – period.
When a company splits its stock, investors get more shares but at a lower price per share.
Take a 2-for-1 split: 100 shares at $50 becomes 200 shares at $25. Same total value.
It’s like breaking a $20 bill into two $10s – you’re not richer, you just have more pieces of paper.