
Successful market timing blends technical analysis, fundamental indicators, and sentiment tracking – but it’s no magic formula. Smart traders analyze chart patterns, moving averages, and volume while keeping tabs on P/E ratios and economic data. Risk management through position sizing and stop-losses remains essential. Though markets trade sideways 75% of the time, understanding entry points through multiple lenses helps identify those elusive “buy low” moments. The journey to mastery requires more than just surface-level understanding.

While countless investors dream of perfectly timing the stock market‘s ups and downs, the reality isn’t so simple. The age-old mantra of “buy low, sell high” sounds great in theory, but executing it consistently requires far more than just gut instinct. Smart traders know this. They rely on a complex mix of technical and fundamental analysis to spot potential entry points.
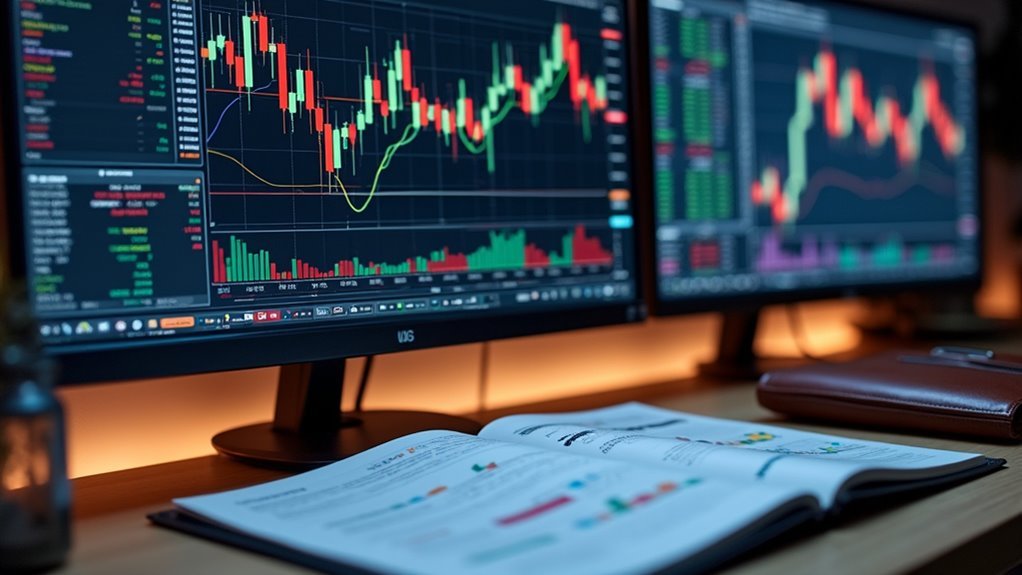
Market timing is more art than science – smart investors combine technical and fundamental analysis rather than relying on intuition alone.
The tools of the trade range from straightforward chart patterns to sophisticated momentum indicators. Moving averages tell one story. RSI and MACD tell another. But here’s the kicker – even with all these fancy indicators, nobody gets it right every time. Not even close. Volume confirmation is critical for validating the reliability of price movements. Markets remain in trading ranges about 75% of the time, making trend identification crucial.
Fundamental analysis adds another layer to the timing puzzle. Investors scrutinize P/E ratios, dividend yields, and earnings projections like they’re reading tea leaves. They track GDP numbers, inflation rates, and every whisper from the Federal Reserve. Sometimes it works. Sometimes it doesn’t. Markets have a funny way of defying logic. While market corrections are natural resets that occur periodically, they can create attractive entry points for patient investors.
Sentiment indicators offer glimpses into the market’s collective psychology. When the VIX spikes, fear is running high. When everyone’s bullish, contrarians start sweating. Fund flows and media coverage can signal turning points – if you know how to read them.
And let’s not forget those quirky seasonal patterns. The January effect, Santa Claus rally, “sell in May and go away” – they’re real phenomena, backed by historical data.
Economic cycles provide broader context for timing decisions. Leading indicators point one way. The yield curve points another. Employment data adds its own spin. But timing based on economic signals isn’t exactly a science. Markets often move months before the economy does.
Risk management remains the unsung hero of market timing. Dollar-cost averaging might not be sexy, but it works. Stop-loss orders protect capital. Position sizing prevents disaster. Diversification smooths the ride.
The smartest investors know that perfect timing is impossible, but smart risk management is essential. That’s not just wisdom – it’s survival.
Frequently Asked Questions
How Do Stock Trading Taxes Differ Between Short-Term and Long-Term Investments?
Short-term stock trades (held under a year) get slammed with regular income tax rates up to 37%. Ouch.
Long-term investments? Now that’s a different story. Hold stocks over a year, and those tax rates drop dramatically – we’re talking 0%, 15%, or 20%, depending on income.
Pretty sweet deal. The government really wants people playing the long game here. Smart move.
What Role Do Company Earnings Reports Play in Stock Price Movements?
Earnings reports hit stocks like a sledgehammer. When companies beat expectations, shares often soar. Miss those targets? Watch out below.
These quarterly announcements trigger immediate price swings based on revenue, profits, and future guidance. Big surprises cause bigger moves – it’s simple math.
Market pros obsess over every detail, from gross margins to cash flow. The whole show repeats every three months, like clockwork.
Should Investors Use Margin Trading to Maximize Potential Returns?
Margin trading is a double-edged sword.
While it can amplify returns during bull markets, it can also devastate portfolios when stocks tank.
Think twice that gain, double that pain.
Experienced investors sometimes use margin strategically, but it’s not for the faint of heart.
Those margin calls? They always seem to come at the worst possible time.
Interest charges eat into profits too, making the whole game even trickier.
How Do Global Economic Events Impact Individual Stock Performance?
Global economic events hit stocks like dominoes falling. A war breaks out? Energy stocks surge, travel stocks tank.
Central banks hike rates? Tech stocks stumble, banks smile.
Currency shifts? Exporters cheer or weep.
It’s all connected. Economic growth boosts profits across sectors, while recessions hammer them down.
Market sentiment follows the headlines – good news lifts stocks, bad news crushes them. Simple cause and effect.
What Are the Pros and Cons of Automated Trading Systems?
Automated trading systems are game-changers – lightning-fast execution, zero emotional baggage, and 24/7 market monitoring. They’ll happily trade while humans sleep.
But they’re not perfect. Technical glitches can wreak havoc, and setup costs aren’t cheap. These robots need constant babysitting and tweaking.
Sure, they eliminate human error, but they can’t adapt to unexpected market chaos like humans can. Some excel at high-frequency trades, others crash spectacularly.