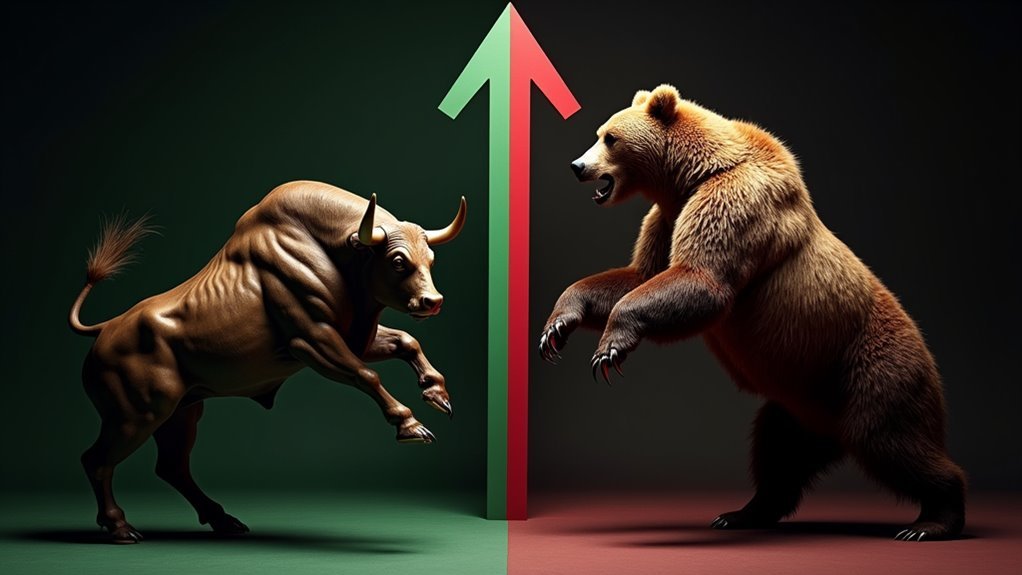
Bull and bear markets represent Wall Street’s split personality disorder. Bulls charge upward with a 20% rise from recent lows, lasting about 2.7 years with average gains of 114.9%. Bears swipe downward with a 20% drop from highs, typically dragging on for 289 days and destroying 35.6% of value. Bulls thrive on greed and economic growth, while bears feed on fear and recession. The deeper story of this financial tug-of-war reveals surprising patterns.

The eternal tug-of-war between bulls and bears defines Wall Street’s emotional rollercoaster. These two beasts have been battling it out since the stock market’s inception, creating a fascinating dance of greed and fear. Bull markets charge upward with a 20% rise from recent lows, while bear markets lumber down with a 20% drop from recent highs. Simple enough, right?
Wall Street’s eternal battle: Bulls charge up with greed while bears lumber down with fear, locked in an endless market dance.
Numbers tell the real story. Bull markets swagger around for an average of 2.7 years, delivering a whopping 114.9% gain to patient investors. Bears? They’re more like unwanted houseguests who stick around for about 289 days, destroying 35.6% of market value before finally leaving. The mother of all bull runs lasted from 1987 to 2000, racking up an eye-popping 582% gain. Since 1942, dollar-cost averaging has proven to be an effective strategy for navigating both market conditions.
Meanwhile, the nastiest bear mauled investors from 1929 to 1932, obliterating 86.2% of market value. The economy plays favorites. Bull markets love good news: rising GDP, low unemployment, and consumers spending like sailors on shore leave. Bears thrive on misery: falling GDP, pink slips everywhere, and shoppers clutching their wallets like they’re full of gold. Strong company profits typically accompany these upward market trends.
Corporate profits soar during bull markets – shocking, as we understand. Psychology drives these market beasts. Bulls make investors feel like financial geniuses, pushing them to take bigger risks and buy more stocks. Bears turn those same investors into nervous wrecks, sending them scrambling for the exits or hoarding cash under their mattresses. Market sentiment is contagious, and everyone catches the fever. Regular investing intervals help remove emotional decision-making from the investment process.
Since 1928, we’ve seen 27 bull markets and 27 bear markets. Talk about perfect symmetry. Bull markets dominate recent decades, but bears never stay away for long. It’s a cycle as predictable as seasons, just less reliable. High trading volume and IPO frenzies mark bull markets, while bears bring volatility and trading ghost towns.
Supply and demand play their parts too – bulls create shortages, bears flood the market. That’s Wall Street’s circle of life.
Frequently Asked Questions
How Long Do Bull and Bear Markets Typically Last?
Bull markets are marathon runners, lasting an average of 8.9 years.
The longest bull charged ahead for 11 years from 2009-2020.
Bear markets? They’re more like quick sprints – typically hanging around for just 1.4 years.
The nastiest bear growled for 2.8 years during the Great Depression.
Most bears lurk between 3 months and 1.7 years, while bulls generally run between 2.7 and 9.1 years.
Can Individual Stocks Be in a Bull Market During a Bear Market?
Yes, individual stocks can absolutely swim upstream during broader market downturns.
While the overall market tanks, certain companies might be crushing
What Causes the Transition Between Bull and Bear Markets?
Market shifts happen when multiple factors collide.
Economic reality hits hard – GDP tanks, unemployment spikes, or inflation rages.
Sometimes it’s external shocks like COVID-19 or war.
How Do International Markets Affect Local Bull and Bear Markets?
International markets pack a serious punch on local bull and bear trends.
Thanks to global interconnectedness, when major markets sneeze, everyone catches a cold. Financial contagion spreads like wildfire – just look at the 2008 crisis.
Currency swings hit multinational profits hard. Emerging markets, especially China, can trigger worldwide ripples.
Central bank moves in one country now send shockwaves everywhere. It’s a small world after all – for better or worse.
Should Investors Change Their Investment Strategy During Market Transitions?
Investors shouldn’t drastically alter their core investment strategy during market shifts. Long-term perspective is key.
Smart investors stick to their established plans, though they might make minor tactical adjustments. Market timing rarely works. Regular rebalancing and dollar-cost averaging typically outperform reactive changes.
History shows that emotional decisions during shifts often lead to missed opportunities. The market rewards patience, not panic.


