Technical analysis looks at price patterns and charts instead of company financials. Traders use specific tools like moving averages and RSI to spot market trends and make predictions. It’s based on the idea that history repeats itself in the markets – yeah, really. Charts show everything from basic line graphs to fancy candlestick patterns that reveal price action. The whole thing works because human psychology drives market behavior. There’s way more to this story than meets the eye.
While many investors obsess over company financials and economic data, technical analysts take a different approach. These chart-loving traders couldn’t care less about P/E ratios or quarterly earnings – they’re too busy studying price patterns and volume trends. Technical analysis operates on a simple premise: history repeats itself, and market movements tend to follow predictable patterns. It’s like reading tea leaves, except with fancy graphs and mathematical indicators.
Technical analysis ignores fundamentals to focus on charts and patterns, betting that market history repeats itself in predictable ways.
The foundation of technical analysis rests on a few key principles. First, market action supposedly discounts everything – meaning all known information is already reflected in prices. Second, prices move in trends until something happens to change that trend. And third, human psychology (yes, that includes fear, greed, and pure panic) plays a massive role in market behavior. The integration of multiple timeframes helps traders develop a more comprehensive understanding of market movements. Supply and demand dynamics drive price movements in all markets.
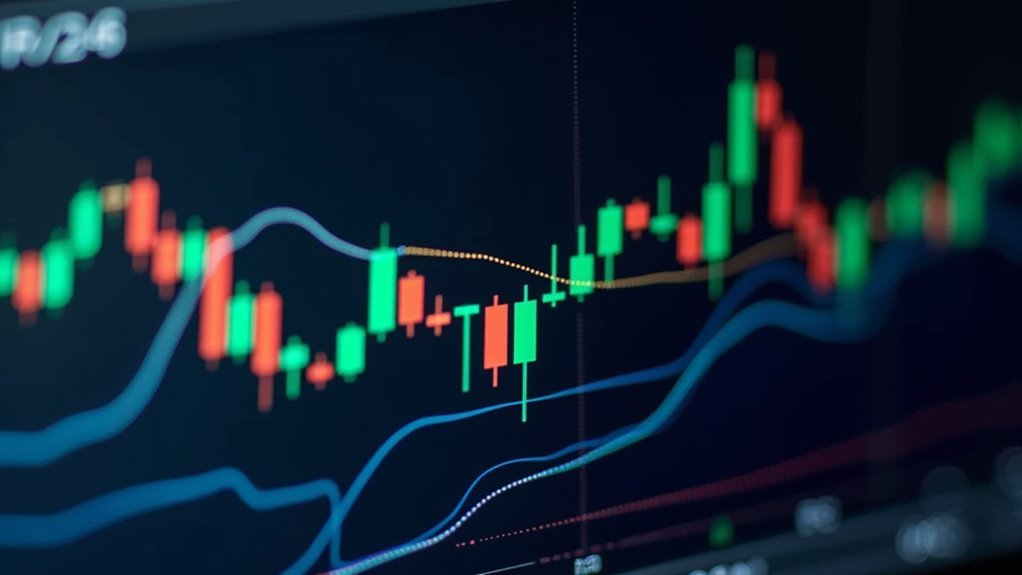
Technical analysts use various types of charts to spot patterns. Line charts show basic price movement. Bar charts offer more detail. But the real crowd-pleaser? Candlestick charts, which display price action in a way that even makes losing money look artistic. These visual tools help traders identify trends, support levels, and resistance points – the invisible lines that prices seem to bounce off like a pinball machine. Both continuation patterns and reversal patterns help predict future price movements.
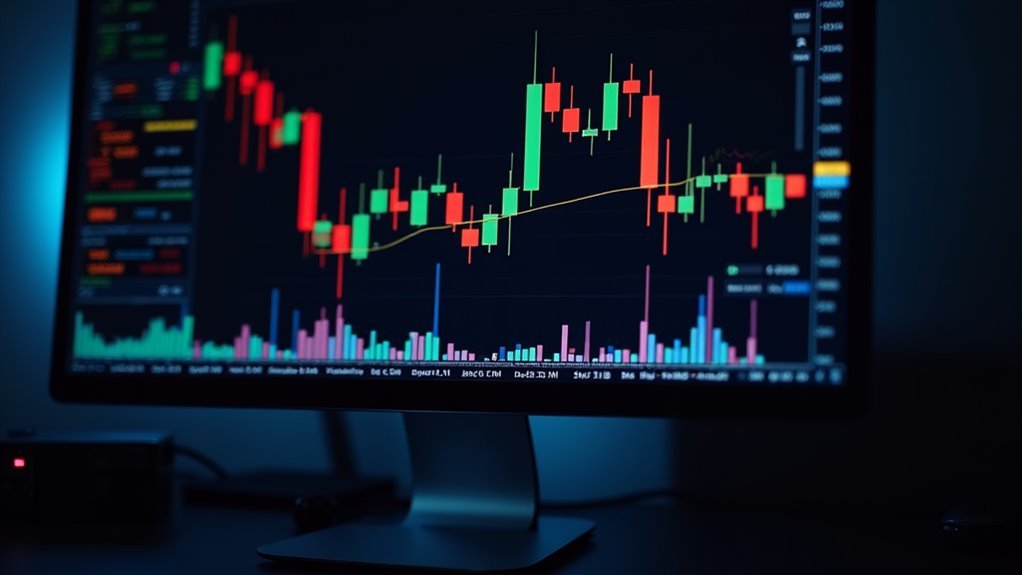
The technical analyst’s toolbox includes an array of indicators with intimidating names. Moving averages smooth out price data. The Relative Strength Index (RSI) tells when something’s overbought or oversold. MACD measures momentum. Bollinger Bands track volatility. It’s like a Swiss Army knife of market analysis tools, each serving a specific purpose.
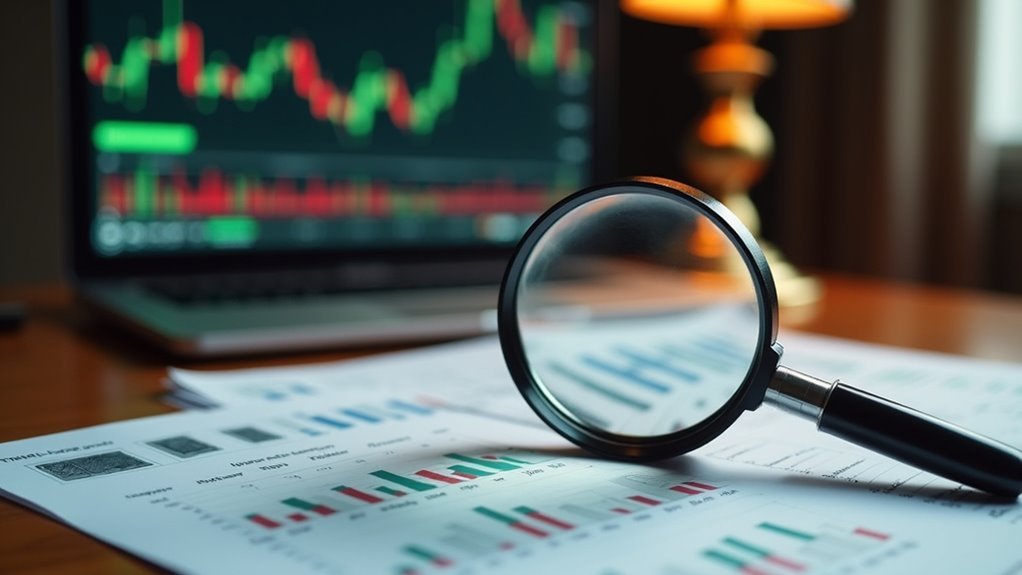
Chart patterns are where things get interesting. Head and shoulders patterns signal potential reversals. Double tops and bottoms suggest the trend might flip. Triangles, cups and handles, flags, and pennants – it’s like connecting dots to predict the future. But here’s the catch: no pattern is foolproof.
That’s why successful technical analysts combine multiple tools and always have a solid risk management plan. It’s not fortune-telling – it’s probability-based trading based on historical patterns.
Frequently Asked Questions
How Much Money Should I Invest When Starting With Technical Analysis?
A conservative approach starts with $500-$1000 – the minimum for most brokers.
Smart traders begin with paper trading to test strategies risk-free. Once live, they risk only 1-2% per trade. No more than they can afford to lose. Period.
Some hotshots jump in with big money. Bad idea. Building slowly beats blowing up an account.
Experience matters more than account size.
Which Charting Software or Platform Is Best for Beginners?
TradingView stands out as a top choice for beginners.
It’s free, packed with features, and doesn’t require downloading software. The platform’s user-friendly interface makes chart reading less intimidating.
For those willing to spend money, TC2000 offers a solid entry point at $29.99/month.
Both platforms provide essential tools – customizable charts, technical indicators, and drawing features.
Plus, their active communities help newbies learn the ropes.
How Long Does It Take to Become Proficient in Technical Analysis?
Becoming proficient in technical analysis typically takes 3-6 months of dedicated study. Daily commitment matters – two hours minimum.
Some traders get it faster, others never do. Previous market experience helps. Fast learners nail the basics: chart patterns, indicators, and trend analysis.
The real challenge? Managing emotions and developing discipline. Natural pattern recognition skills can speed things up considerably.
Can Technical Analysis Be Combined With Fundamental Analysis Effectively?
Technical and fundamental analysis absolutely work together – it’s like having two eyes instead of one.
Studies show traders using both methods tend to get better results. The combo provides a fuller market picture: fundamentals reveal the “why,” technicals show the “when.”
Sure, it takes more work mastering two disciplines. But major financial institutions do it. Research backs it up. It’s worth the effort.
What Percentage of Traders Successfully Make Money Using Technical Analysis?
The numbers aren’t pretty. Studies show roughly 95% of traders lose money, with technical analysis offering no magic solution.
Only about 4% make a consistent living, even with proper training and capital. Another 10-15% break even or make small profits, but not enough to quit their day jobs.
Women oddly outperform men. Longer-term trading shows better success rates than day trading’s brutal statistics.