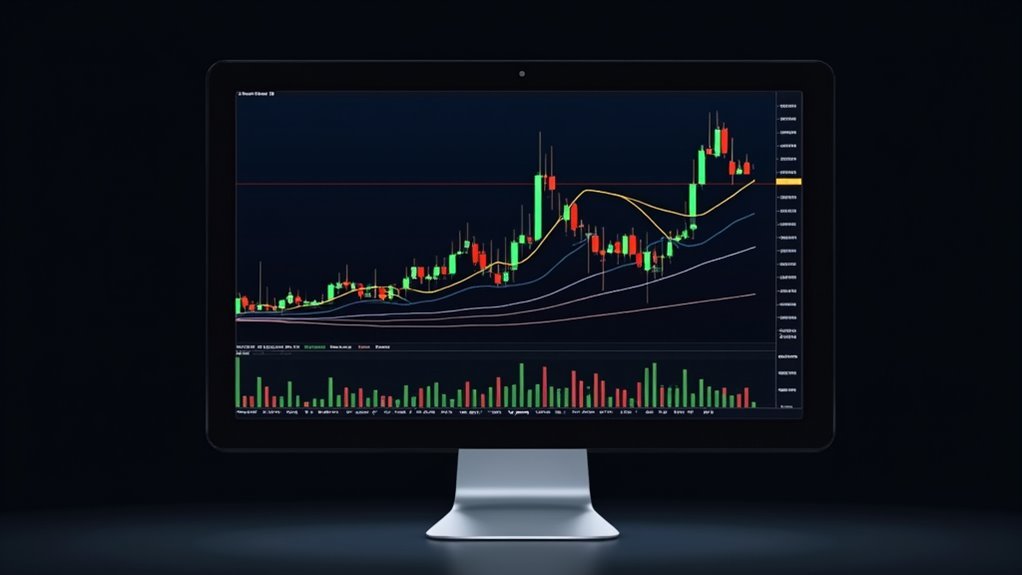
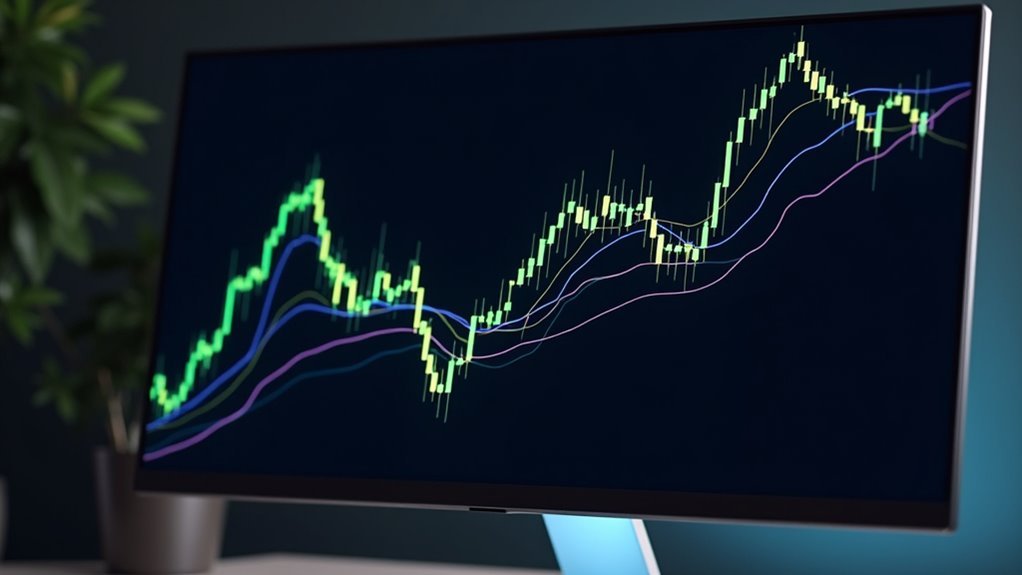
Stock charts tell cold, hard truths about market behavior. Beginning investors must grasp essential patterns like head and shoulders reversals, double tops and bottoms, and triangle formations. Different timeframes serve different trading styles – from hyper day traders to patient long-term investors. Price trends, shown through moving averages and volume indicators, reveal the market’s emotional state. Technical analysis may seem intimidating, but these basic patterns reveal deeper market insights.

Charts are the crystal ball of stock trading. Every squiggle, every line, every pattern tells a story – if you know how to read them. And let’s be honest, without understanding these basic patterns, you might as well be throwing darts at the financial pages blindfolded.
The foundation starts with understanding what you’re looking at. Price data runs up and down the vertical axis, while time marches across the horizontal. Volume bars at the bottom show trading activity – think of them as the market’s heartbeat. Moving averages smooth out the noise, making trends easier to spot. It’s like putting on glasses when everything’s blurry. Using multiple technical indicators together provides more reliable trading signals. Risk management improves when traders identify key levels.
Reading charts is like learning a new language – the numbers tell stories once you understand their essential grammar.
Different charts serve different purposes. Line charts? Simple. They just connect the closing prices. Bar charts and candlesticks get fancy, showing the full range of price action. Point and figure charts strip away everything but price changes. Renko charts? They’re the minimalists of the chart world, filtering out the small stuff. Unlike fundamental analysis, these charts focus purely on price movements and patterns.
Timeframes matter. Day traders live and die by intraday charts. Swing traders prefer daily views. Long-term investors? They’re looking at weekly or monthly charts, sometimes even yearly ones. It’s all about perspective.
Trends are the bread and butter of chart analysis. Uptrends show higher highs and lows – like climbing stairs. Downtrends? The opposite. Think falling down those same stairs, painfully. Trendlines connect the dots, while channels keep prices boxed in like cattle.
Support and resistance levels are where the real drama happens. Support is where buyers step in, resistance is where sellers take control. Previous highs and lows often flip roles, like some weird market karma. Round numbers? They mess with traders’ heads.
Chart patterns tell the biggest stories. Head and shoulders patterns signal reversals – the market equivalent of a U-turn. Double tops and bottoms? The market’s way of saying “enough is enough.” Triangles show indecision, while cups and handles suggest the bulls are getting ready to run.
And volume? It’s the truth serum that confirms or denies everything else.
Frequently Asked Questions
How Long Should I Practice Chart Analysis Before Making Real Investments?
Stock chart analysis isn’t a sprint – it’s more like training for a marathon.
Most traders need 3-6 months just to understand the basics. Paper trading follows, requiring another 3 months minimum. Serious traders typically spend 6-12 months practicing before risking real money.
That’s right – we’re talking about a solid year of learning. Markets don’t care about impatience.
Which Charting Software or Platform Is Best for Beginners?
TradingView takes the crown for beginners. Period.
It’s free, packed with features, and doesn’t skimp on the good stuff. The platform’s user-friendly interface makes chart reading less intimidating, while its massive community shares trading ideas and setups.
Plus, there’s no need to shell out cash for fancy subscriptions right away. Yahoo Finance works too, but TradingView’s tools and social features are hard to beat.
Can Stock Chart Patterns Predict Market Crashes Effectively?
Chart patterns can help spot potential crashes, but they’re far from foolproof.
Historical data shows some impressive stats – head and shoulders patterns are 61% accurate, double tops hit 72% reliability.
But here’s the catch: patterns often fail during black swan events.
No single chart formation screams “incoming crash!”
Smart analysts combine multiple patterns, track market breadth, and watch fundamental metrics too.
Should I Combine Chart Analysis With Other Investment Research Methods?
Chart analysis alone? Not enough.
Smart investors use multiple tools. Technical analysis shows price patterns and timing, while fundamentals reveal the deeper story – earnings, management quality, competitive edge.
Together they paint a clearer picture. Like solving a puzzle with more pieces.
Some of the most successful traders combine both approaches. No single method catches everything.
Charts plus research equals better insights.
How Often Do Chart Patterns Fail to Predict Price Movements Accurately?
Chart patterns fail pretty frequently – it’s just a fact of trading life.
Failure rates vary widely: head and shoulders patterns bomb around 17-19% of the time, while cup and handle patterns miss the mark a whopping 38%. Most other common patterns? They fail between 20-32% of cases.
No pattern’s perfect. Market conditions, timeframes, and volume all affect reliability. Sometimes charts just do whatever they want.


